THE PROBLEM: Harmful algal blooms (HABs) have proliferated in aquatic ecosystems, damaging wildlife and harbouring invasive species. The extent of this phenomenon is hard to asses on Earth, so data from space is required.

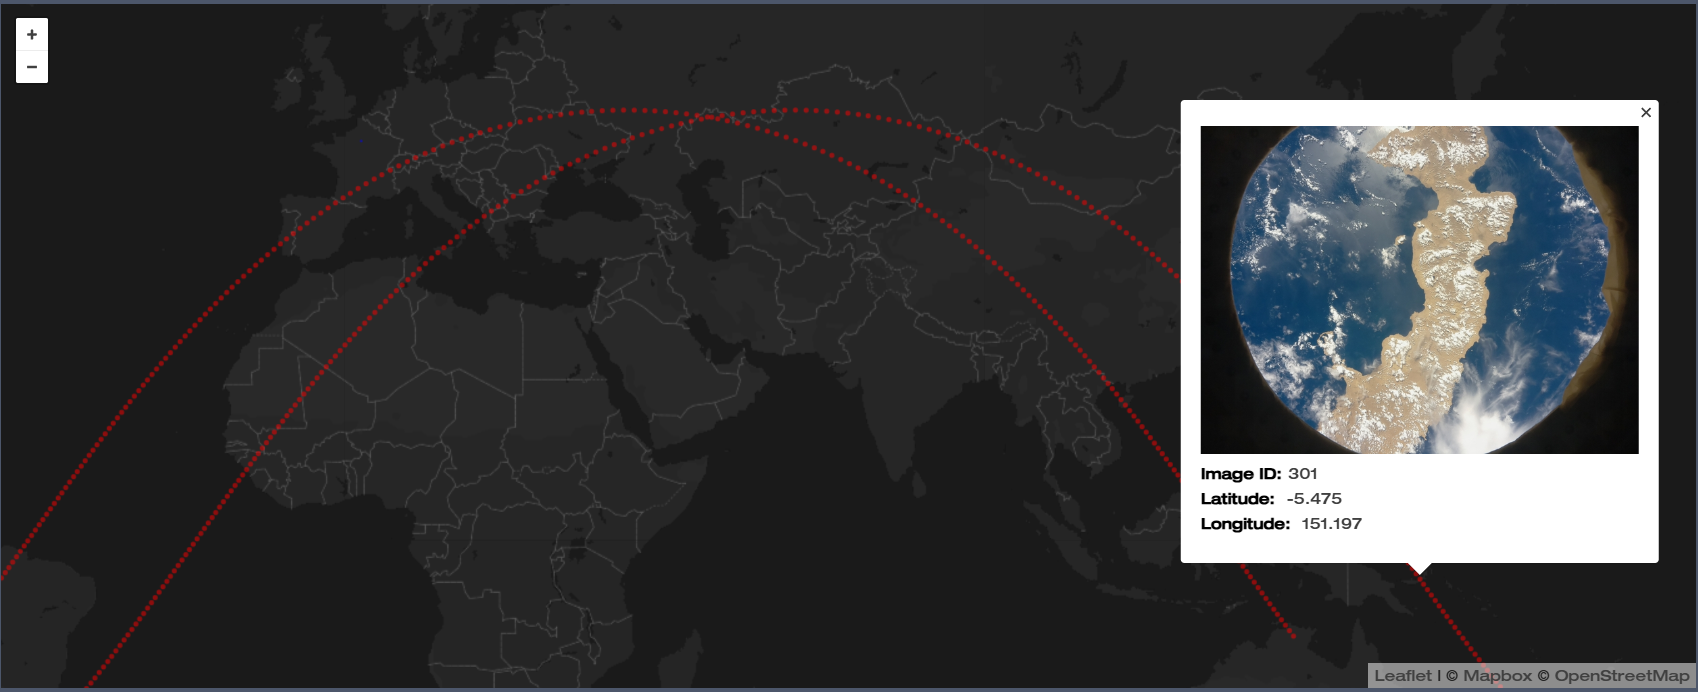
User interface on our website with each red dot representing an image
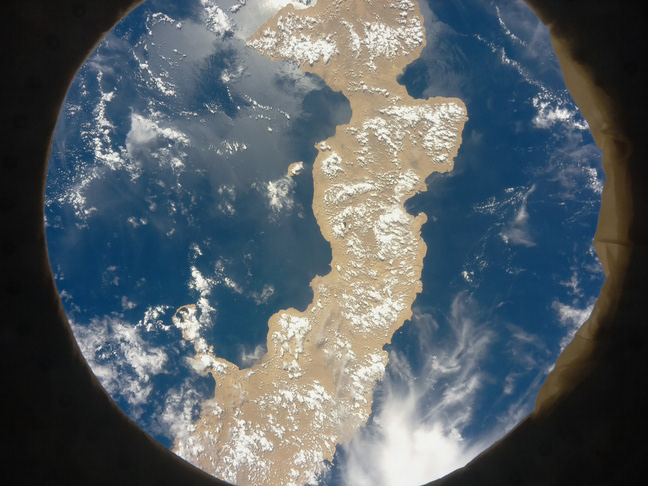
Near-infrared image captured from space
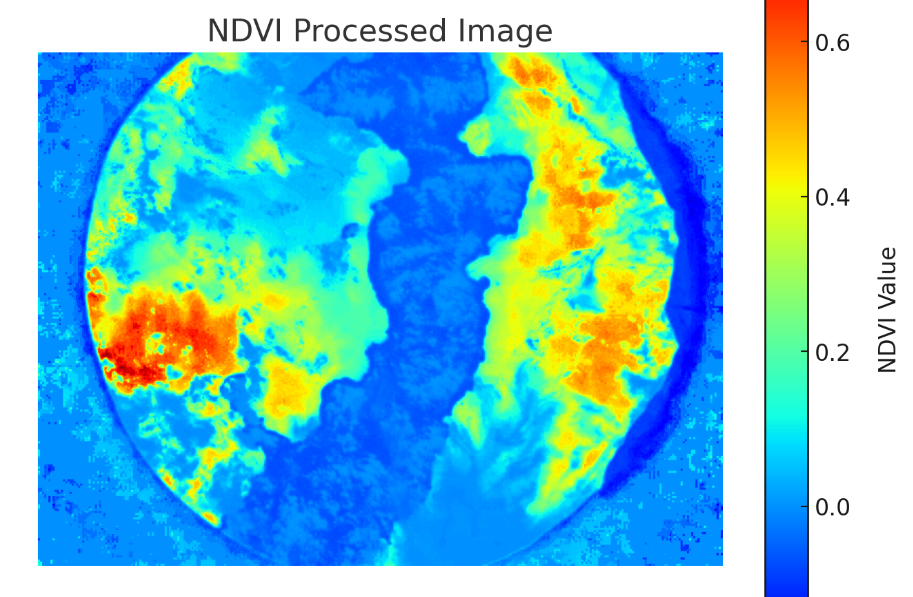
Red spots show areas with high density of algae
THE SOLUTION: I assembled and led a multidisciplinary team to participate in the European Space Agency AstroPi competition. We coded a Raspberry Pi microcomputer to capture infrared photos of the Earth from the International Space Station. We then processed our data and presented it in an intuitive and educational website: https://astropi.diegovano.com/.
We used Leaflet, an open-source JS library to create interactive map visualise the trajectory of the International Space Station, clicking on each red point shows the photo captured at those coordinates. In our report, we presented our findings linking the presence of large HABs with intensive farming and industry.
The ESA astropi mission patch
SKILLS:
○ Web design
○ Using libraries
○ Data analysis
○ Team leadership
TOOLS:
○ HTML / CSS
○ Python
○ Raspberry Pi
○ JavaScript